Maximize your insights
Gain a deeper, more complete assessment of your samples with protein, total mRNA, and morphology in one.
Profile entire tissue sections
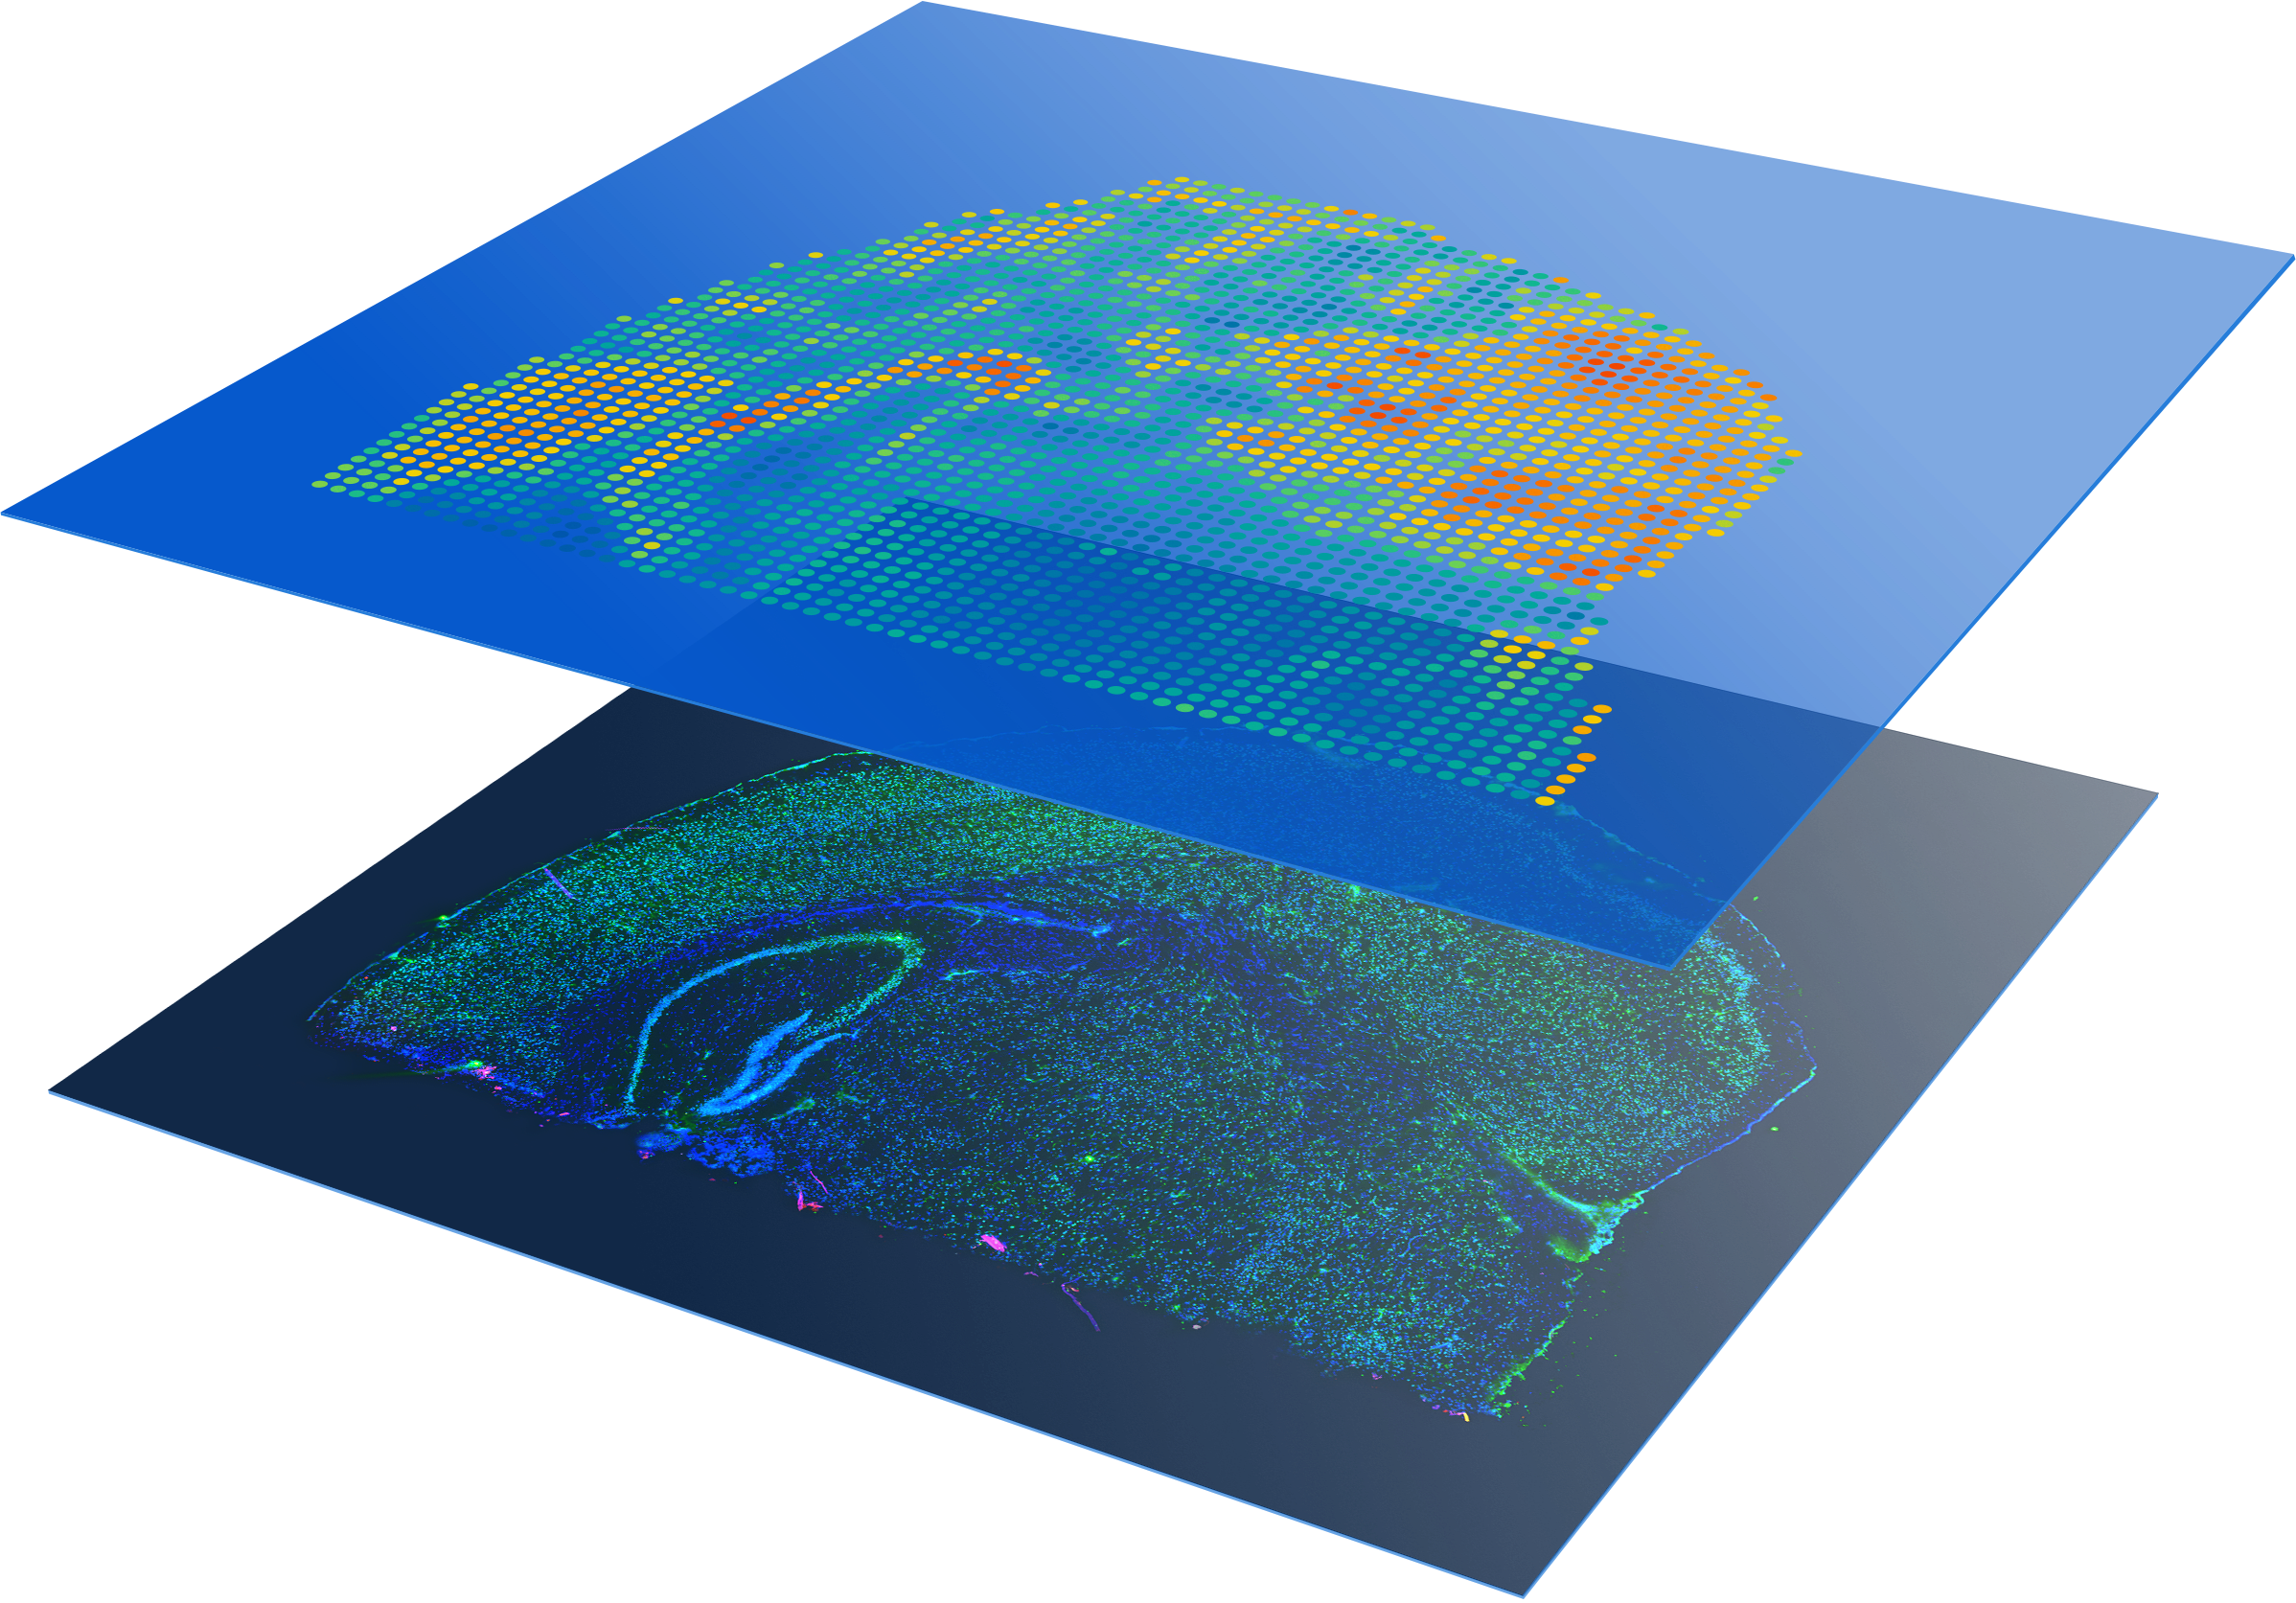
Visualize protein and whole transcriptome expression, without selecting regions of interest.
Accessible technology
Use standard microscopy, immunofluorescence staining protocols, and antibodies.
Streamlined data analysis
Combine histology or protein expression profiles with gene expression data in easy-to-use software.
One-day lab workflow
From tissue section to sequencing-ready library in one day.
Diverse sample compatibility
Demonstrated on multiple mouse and human tissues
Explore what you can do
Gain a complete view of disease complexity
Discover new biomarkers and identify novel cell types and states
Map the spatial organization of cell atlases
Identify spatiotemporal gene expression patterns
Flexible Multiomic Spatial Profiling
Gain multiomic insights by combining protein expression data with whole transcriptome analysis or focus on your genes of interest using targeted gene expression panels.
Targeted Gene Expression Panels
Choose from pre-designed cancer, immunology, neuroscience and gene signature panels with the ability to add up to 200 custom genes.
Highly Multiplexed Protein Detection (Coming soon)
Perform multiomic analysis by leveraging Feature Barcode technology to vastly increase the number of proteins detected compared to fluorescently labeled approaches.
With our comprehensive solution you get:
Powerful discovery
Envision the spatial organization of newly discovered cell types, states, and biomarkers with protein detection and whole transcriptome analysis.
Seamless integration
Validate discoveries or explore new hypotheses with the ability to transition seamlessly between whole transcriptome and targeted analysis from the same library preparation.
Focused expansion
Guided by protein expression patterns, scale up from a few genes of interest to all relevant genes and pathways by combining high-throughput spatial gene expression with the efficiency of targeted panels.
Proven Results
Proven Results
Publications
Search hundreds peer-reviewed publications using Spatial Gene Expression.
Transcriptome-scale spatial gene expression in the human dorsolateral prefrontal cortex
Transcriptome-scale spatial gene expression in the human dorsolateral prefrontal cortex
bioRxiv, 2020, Kristen R. Maynard, et al.
bioRxiv, 2020, Kristen R. Maynard, et al.
Spatiotemporal dynamics of molecular pathology in amyotrophic lateral sclerosis
Spatiotemporal dynamics of molecular pathology in amyotrophic lateral sclerosis
Science, 2019, Silas Maniatis, et al.
Science, 2019, Silas Maniatis, et al.
A Spatiotemporal Organ-Wide Gene Expression and Cell Atlas of the Developing Human Heart
A Spatiotemporal Organ-Wide Gene Expression and Cell Atlas of the Developing Human Heart
Cell. 2019, Michaela Asp, et al.
Cell. 2019, Michaela Asp, et al.
Spatial maps of prostate cancer transcriptomes reveal an unexplored landscape of heterogeneity
Spatial maps of prostate cancer transcriptomes reveal an unexplored landscape of heterogeneity
Nature Communications. 2018, Emelie Berglund, et al.
Nature Communications. 2018, Emelie Berglund, et al.
Resources
Find the latest app notes and other documentation Spatial Gene Expression.
Our End-to-End Solution
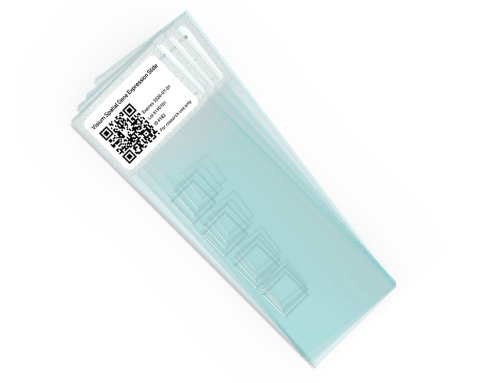
Visium Spatial Tissue Optimization Slides
Easily adoptable within existing lab infrastructure, no need for a new instrument.
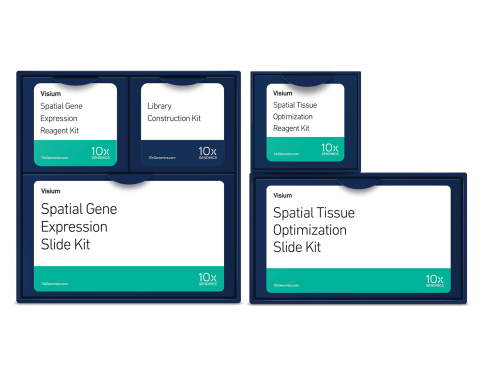
Visium Spatial Gene Expression Reagents
With our reagent kits, capture whole transcriptome gene expression with spatial resolution across an entire tissue section.
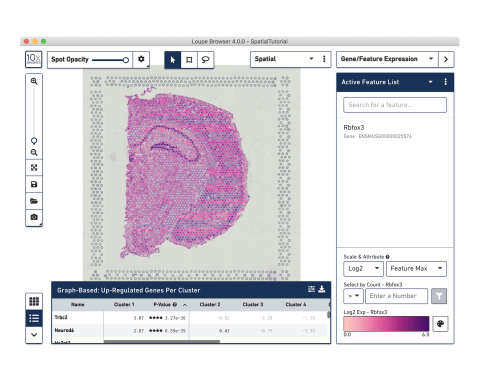
Analysis and Visualization Software
Our analysis pipelines
Our visualization software

World-Class Technical and Customer Support
Our expert support team can be contacted by phone or email.
Products Required
Visium Spatial Proteomics is enabled with these 10x Genomics products:
- Visium Spatial Tissue Optimization Slide and Reagent Kit
(1000193)
- Visium Spatial Gene Expression Slide and Reagent Kit
(1000187: 4 rxn, or 1000186 : 16 rxn)
- Dual Index Kit TT Set A, 96 reactions
(1000215)
Analysis and visualization software:
- Space Ranger
(version 1.1 or above)
- Loupe Browser
(version 4.1 or above)
Additional materials required:
- Equipment and reagents necessary to support histology or immunofluorescence staining protocols
- Microscopy equipment for digital image capture and export
- Sequencing equipment
Our Support page provides a detailed summary of products used in the Visium Spatial Workflow, and recommended compatible products.
Workflow
- 1
Prepare your sample
Embed, section, and place fresh-frozen tissue onto a Capture Area of the gene expression slide. Every Capture Area has thousands of barcoded spots, each containing millions of capture oligonucleotides with spatial barcodes unique to that spot.
Resources - 2
Stain and image the tissue
Utilize standard fixation and staining techniques, such as Hematoxylin and Eosin (H&E) staining for morphology, or immunofluorescence (IF) for protein detection. Visualize tissue sections on slides using either brightfield or fluorescent microscopy to capture tissue images used to complement spatial gene expression data in downstream analyses.
Resources - 3
Permeabilize tissue and construct library
Permeabilize the tissue to release mRNA from the cells, which binds to the spatially barcoded oligonucleotides present on the spots. A reverse transcription reaction produces cDNA from the captured mRNA. The barcoded cDNA is then pooled for downstream processing to complete a sequencing-ready library.
Resources - 4
Sequence
The resulting 10x Barcoded library is compatible with standard NGS short-read sequencing on Illumina sequencers, for massive transcriptional profiling of entire tissue sections.
Resources - 5
Analyze and visualize your data
Use our Space Ranger analysis software to process your Spatial Gene Expression data, and interactively explore the results with our Loupe Browser visualization software.
Do I need to be a bioinformatician to use Loupe?
Loupe is a point-and-click software that’s easy for anyone to download and use.
Resources
Frequently Asked Questions
The Visium Gene Expression workflow is complementary to your current immunofluorescence protocols, so the number of protein targets you can detect is dependent on your antibody selection and imaging configuration. For example, with a standard confocal microscope, 4 channels are available for signal capture, which corresponds to a minimum of 4 fluorescent labels.
Yes, there are several key differences between standard IF and the IF protocol used with Visium. Please refer to the IF Demonstrated Protocol for additional detail.
Impact on Visium performance may vary from tissue to tissue due to the high sensitivity of the Visium assay. However, the spatial organization of gene expression and cell cluster detection is comparable between H&E and IF.
Visium is compatible with fresh-frozen tissues containing mRNA. Right now, Visium Spatial Gene Expression is not compatible with fixed sample types. However, it is something that we are actively working to enable in the future.
A list of tissues successfully tested in-house can be found here.
10x Genomics provides two types of software to help you analyze your data: Space Ranger and Loupe Browser. Space Ranger is an analysis software which automatically overlays spatial gene expression information on your tissue image and identifies clusters of spots with similar transcription profiles. You can then use Loupe Browser, a visualization software, to interactively explore the results. You can download Space Ranger and Loupe Browser from the 10x Genomics Support site at no cost.
